


With this Excel spreadsheet you can quickly rank the instruments of your ETF Rotation System at the end of each month. This simple tool can save you some money that would otherwise be spent as recurring membership costs out there, simply for the
privilege of determining the go-to instruments for the upcoming month in
your Momentum based ETF Rotation Portfolio.
To recap, here is the explanation provided about the ranking methodology in the first article of the ETF Rotation Systems to beat the Market series:
It was a basic general idea. The initial goal of the series was to explore the concept of momentum based rotations, rather than writing up an advanced Maths manifest. But over time, some readers have asked for more precise mathematical details and, if possible, an Excel evaluation tool.
THE EXCEL FILE
Download Free ETF Rotation Evaluation Tool
The Excel document has three spreadsheets. The first one contains the actual calculations and it is the only one you need on a month to month basis. Spreadsheets number two and three just contain detailed explanations of the process of Ranking the ETFs.

CALCULATIONS SPREADSHEET
The first spreadsheet (Calculations), contains five sections, but really, the first one (Historical Closing Prices) is the only one you have to modify on a monthly basis.

The default example in the spreadsheet is a rotation system made up of symbols: SPY, EFA, IEF, GLD, ICF and DBC. Of course you may need to edit that according to your needs.
STEPS
At the end of the month, or whatever your evaluation period is, all you need to do is obtain closing price data for each of the symbols in your ETF Rotation system. You can use finance.google.com for this purpose.
Type the ticker symbol of your instrument, for example: SPY and press the search button.
After that, click on "Historical Prices"

On the Historical prices page, just click where it says "Download to spreadsheet"

You immediately get an spy.csv file which can be opened with Excel.
From this file, all we want is closing prices. So, we simply copy the "Close" column values (Column E) and we paste the content in our spreadsheet, specifically the column that corresponds to the SPY symbol. Column B in this case.
Repeat the process for each one of your symbols and that's it!
In section 2, the one-day returns are automatically calculated and sections 3 and 4 crunch the numbers. The final Overall Rank is displayed in section 5:
 A smaller number represents a better ranking. So, if you were to invest in the two best symbols each month, you would select the instruments that obtained Overall Rank values of 1 and 2.
As you can see, there is also a column indicating whether each instrument is above its 10-Month Moving Average at the moment. This will allow you to quickly rule out an instrument in case you are applying the long term trend "filter rule", even if the instrument ends up well ranked.
Final Notes
In all likelihood you may need to modify the spreadsheet.
If you use a number of instruments greater than the default six, you will need to expand sections 1 and 2 in order include more symbols (columns). You will also need to add more rows in sections 3, 4 and 5 with corresponding formulas. If, on the other hand, you use fewer than 6 symbols, then it's simpler: just remove the necessary number of columns from sections 1 and 2, as well as the necessary number of rows from sections 3, 4 and 5.
Also, some people may prefer different weights for each factor. So, in section 5, you can adjust the weights:
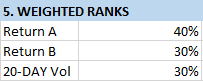
Finally, many investors use momentum based rotation systems that rank the instruments based on returns only. If you want to remove a factor all together (like for instance the 20-day Volatility), you can do so, but then you also have to modify the formulas in section five for each cell.
You can get the default spreadsheet using the below link:
Download Free ETF Rotation Evaluation Tool
Feel free to use, alter and share as you please. The file is shared under the WTFPL License.
I hope it becomes a useful addition to your arsenal.
Cheers,
LT
Interested in ETF Rotation systems?
Here's the entire series:
ETF Rotation Systems to beat the Market - American Equities
ETF Rotation Systems to beat the Market - Global Equities
ETF Rotation Systems to beat the Market - American Equities + TLT + GLD + IYR + EEM
ETF Rotation Systems to beat the Market - SPY + EFA + IEF + GLD + ICF
ETF Rotation Systems to beat the Market - SPY + IWM + EEM + EFA + TLT + TLH + DBC + GLD + ICF + RWX
To recap, here is the explanation provided about the ranking methodology in the first article of the ETF Rotation Systems to beat the Market series:
How are the three best ETFs selected every month?
There are three ingredients involved in the formula:
- The 3-month return (40% weight in the final score)
- The 20-day return (30% weight in the final score)
- The 20-day volatility (30% weight in the final score). Volatility is the annualized standard deviation of daily returns. So, the 20-day Volatility is the standard deviation of the past 20 1-day returns multiplied by sqrt(252) (annualized). The idea is to penalize the instruments that are having large variations in their daily returns. Those that are quiet and consistent are favored.
It was a basic general idea. The initial goal of the series was to explore the concept of momentum based rotations, rather than writing up an advanced Maths manifest. But over time, some readers have asked for more precise mathematical details and, if possible, an Excel evaluation tool.
THE EXCEL FILE
Download Free ETF Rotation Evaluation Tool
The Excel document has three spreadsheets. The first one contains the actual calculations and it is the only one you need on a month to month basis. Spreadsheets number two and three just contain detailed explanations of the process of Ranking the ETFs.
CALCULATIONS SPREADSHEET
The first spreadsheet (Calculations), contains five sections, but really, the first one (Historical Closing Prices) is the only one you have to modify on a monthly basis.
Example of data imported up to the last day of the month
The default example in the spreadsheet is a rotation system made up of symbols: SPY, EFA, IEF, GLD, ICF and DBC. Of course you may need to edit that according to your needs.
STEPS
At the end of the month, or whatever your evaluation period is, all you need to do is obtain closing price data for each of the symbols in your ETF Rotation system. You can use finance.google.com for this purpose.
Type the ticker symbol of your instrument, for example: SPY and press the search button.
After that, click on "Historical Prices"

On the Historical prices page, just click where it says "Download to spreadsheet"
From this file, all we want is closing prices. So, we simply copy the "Close" column values (Column E) and we paste the content in our spreadsheet, specifically the column that corresponds to the SPY symbol. Column B in this case.
Repeat the process for each one of your symbols and that's it!
In section 2, the one-day returns are automatically calculated and sections 3 and 4 crunch the numbers. The final Overall Rank is displayed in section 5:
As you can see, there is also a column indicating whether each instrument is above its 10-Month Moving Average at the moment. This will allow you to quickly rule out an instrument in case you are applying the long term trend "filter rule", even if the instrument ends up well ranked.
Final Notes
In all likelihood you may need to modify the spreadsheet.
If you use a number of instruments greater than the default six, you will need to expand sections 1 and 2 in order include more symbols (columns). You will also need to add more rows in sections 3, 4 and 5 with corresponding formulas. If, on the other hand, you use fewer than 6 symbols, then it's simpler: just remove the necessary number of columns from sections 1 and 2, as well as the necessary number of rows from sections 3, 4 and 5.
Also, some people may prefer different weights for each factor. So, in section 5, you can adjust the weights:
Finally, many investors use momentum based rotation systems that rank the instruments based on returns only. If you want to remove a factor all together (like for instance the 20-day Volatility), you can do so, but then you also have to modify the formulas in section five for each cell.
You can get the default spreadsheet using the below link:
Download Free ETF Rotation Evaluation Tool
Feel free to use, alter and share as you please. The file is shared under the WTFPL License.
I hope it becomes a useful addition to your arsenal.
Cheers,
LT
Interested in ETF Rotation systems?
Here's the entire series:
ETF Rotation Systems to beat the Market - American Equities
ETF Rotation Systems to beat the Market - Global Equities
ETF Rotation Systems to beat the Market - American Equities + TLT + GLD + IYR + EEM
ETF Rotation Systems to beat the Market - SPY + EFA + IEF + GLD + ICF
ETF Rotation Systems to beat the Market - SPY + IWM + EEM + EFA + TLT + TLH + DBC + GLD + ICF + RWX
Go to the bottom of this page in order to see the Legal Stuff
No comments:
Post a Comment