


If you've been following my trading for a while, you know my style is all based on identifying extreme market conditions (overbought/oversold) and selling out of the money Credit Spreads against the prevailing trend at that point. There are hundreds of indicators to identify these conditions, but I like to follow three specific ones which are: Stochastics, McClellan Oscillator and the Number of stocks above their 20 and 50 Day Moving Average.
Since the last ThinkOrSwim update on Sunday, November 24, 2013 something happened to the McClellan Oscillator built-in the platform. As of right now it is displaying a smooth line with values over 2000 (2 thousand) instead of the usual, never smooth line with values ranging between -200 and +200 most of the time. I tried on three different computers with the same result. So this is not an issue with my PC in particular. The indicator was changed at the platform level.
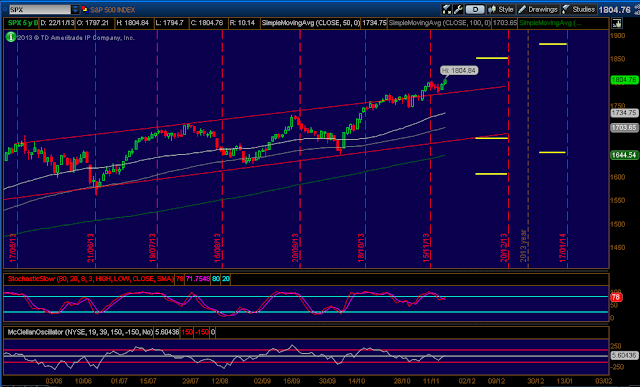
Here's how the McClellan Oscillator usually looks like. Notice the appearance of the oscillator at the bottom of the image bellow the Stochastics (screenshot taken on Saturday, November 23):
(Click on image to enlarge)
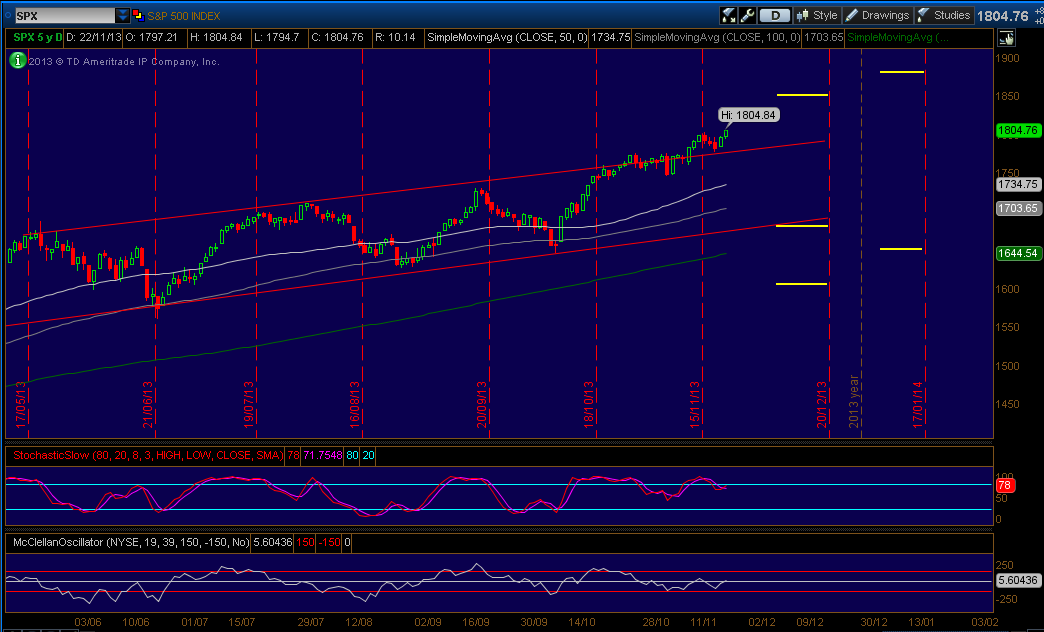
And here's how the oscillator suddenly changed in a drastic way, totally unrelated to its usual values and behavior (screenshot taken on Thursday, November 28):
(Click on image to enlarge)

I contacted both TDAmeritrade and ThinkOrSwim via Twitter to no avail.
What is left?
Well, fortunately ThinkOrSwim allows you to write your own scripts and import them into the platform. Without previous experience writing ThinkOrSwim scripts in their programming language, I decided I had to write my own implementation of the McClellan Oscillator and not wait any longer. And today I am sharing the correct indicator with whomever needs it out there.
I went to the Learning Centre to get familiar with the ThinkScript language. After that I just needed the definition of the McClellan Oscillator. According to Wikipedia the oscillator is the difference between the 19 day EMA of (Advances minus Declines) and the 39 day EMA of (Advances minus Declines). Advances means the number of stocks that went up in the NYSE on a given day, Declines is the number of stocks that went down. In the ThinkOrSwim platform the symbols are $ADVN and $DECN respectively.
I programmed the indicator, compiled it and saved it so you can download it and use it now. I named it LT_McClellanOscillator in order to differentiate it from the one that comes with the platform.
Download McClellanOscillator implemented by The Lazy Trader
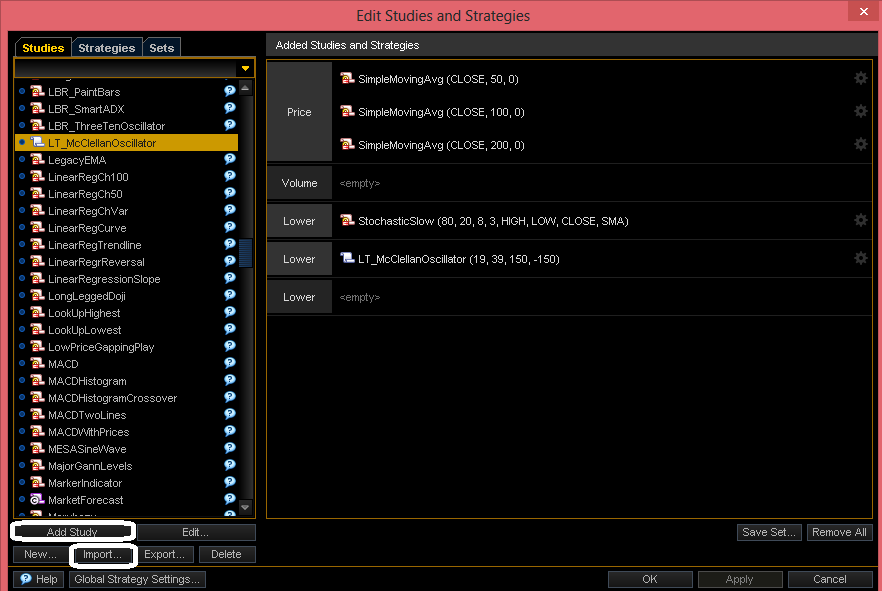
The indicator is a .ts file. Once you save it on your hard disk, go to the Charts tab of your ThinkOrSwim platform, click on the "Edit Studies" button. A pop up window is displayed, click "Import" and select the LT_McClellanOscillatorSTUDY.ts file on your hard disk. The indicator is now added to your platform and you just need to attach it to the chart.
 Find the indicator on the ListBox that appears under the "Studies" tab and click "Add Study". Close the pop up window by clicking "Ok" and you're done.
Here's my platform now displaying my custom McClellan Oscillator! Over which I have full control and won't get screwed anymore with arbitrary TOS updates.
(Click on image to enlarge)

For those curious about the source code, here it is:
# LT_McClellanOscillator
# (c) 2013 http://www.the-lazy-trader.com
# traderlazy@gmail.com
declare lower;
input FastEMAPeriod = 19;
input SlowEMAPeriod = 39;
input OverBoughtLevel = 150;
input OverSoldLevel = -150;
def fastEMA = expAverage( close("$ADVN") - close("$DECN"), FastEMAPeriod );
def slowEMA = expAverage( close("$ADVN") - close("$DECN"), SlowEMAPeriod );
plot Oscillator = fastEMA - slowEMA;
Oscillator.setDefaultColor(color.red);
plot ZeroLine = 0;
ZeroLine.setDefaultColor(color.white);
plot OverboughtBoundary = OverBoughtLevel;
OverboughtBoundary.setDefaultColor(color.white);
plot OversoldBoundary = OverSoldLevel;
OversoldBoundary.setDefaultColor(color.white);
Nothing fancy, just the simple stuff that works, implementing the exact definition of the oscillator.
I compared the values in my platform with those that I have been reporting weekend after weekend on this site and I'm pretty happy to say it is accurate.
Hope it helps someone out there!
Since the last ThinkOrSwim update on Sunday, November 24, 2013 something happened to the McClellan Oscillator built-in the platform. As of right now it is displaying a smooth line with values over 2000 (2 thousand) instead of the usual, never smooth line with values ranging between -200 and +200 most of the time. I tried on three different computers with the same result. So this is not an issue with my PC in particular. The indicator was changed at the platform level.
Here's how the McClellan Oscillator usually looks like. Notice the appearance of the oscillator at the bottom of the image bellow the Stochastics (screenshot taken on Saturday, November 23):
(Click on image to enlarge)
And here's how the oscillator suddenly changed in a drastic way, totally unrelated to its usual values and behavior (screenshot taken on Thursday, November 28):
(Click on image to enlarge)

I contacted both TDAmeritrade and ThinkOrSwim via Twitter to no avail.
What is left?
Well, fortunately ThinkOrSwim allows you to write your own scripts and import them into the platform. Without previous experience writing ThinkOrSwim scripts in their programming language, I decided I had to write my own implementation of the McClellan Oscillator and not wait any longer. And today I am sharing the correct indicator with whomever needs it out there.
I went to the Learning Centre to get familiar with the ThinkScript language. After that I just needed the definition of the McClellan Oscillator. According to Wikipedia the oscillator is the difference between the 19 day EMA of (Advances minus Declines) and the 39 day EMA of (Advances minus Declines). Advances means the number of stocks that went up in the NYSE on a given day, Declines is the number of stocks that went down. In the ThinkOrSwim platform the symbols are $ADVN and $DECN respectively.
I programmed the indicator, compiled it and saved it so you can download it and use it now. I named it LT_McClellanOscillator in order to differentiate it from the one that comes with the platform.
Download McClellanOscillator implemented by The Lazy Trader
The indicator is a .ts file. Once you save it on your hard disk, go to the Charts tab of your ThinkOrSwim platform, click on the "Edit Studies" button. A pop up window is displayed, click "Import" and select the LT_McClellanOscillatorSTUDY.ts file on your hard disk. The indicator is now added to your platform and you just need to attach it to the chart.
Here's my platform now displaying my custom McClellan Oscillator! Over which I have full control and won't get screwed anymore with arbitrary TOS updates.
(Click on image to enlarge)

For those curious about the source code, here it is:
# LT_McClellanOscillator
# (c) 2013 http://www.the-lazy-trader.com
# traderlazy@gmail.com
declare lower;
input FastEMAPeriod = 19;
input SlowEMAPeriod = 39;
input OverBoughtLevel = 150;
input OverSoldLevel = -150;
def fastEMA = expAverage( close("$ADVN") - close("$DECN"), FastEMAPeriod );
def slowEMA = expAverage( close("$ADVN") - close("$DECN"), SlowEMAPeriod );
plot Oscillator = fastEMA - slowEMA;
Oscillator.setDefaultColor(color.red);
plot ZeroLine = 0;
ZeroLine.setDefaultColor(color.white);
plot OverboughtBoundary = OverBoughtLevel;
OverboughtBoundary.setDefaultColor(color.white);
plot OversoldBoundary = OverSoldLevel;
OversoldBoundary.setDefaultColor(color.white);
Nothing fancy, just the simple stuff that works, implementing the exact definition of the oscillator.
I compared the values in my platform with those that I have been reporting weekend after weekend on this site and I'm pretty happy to say it is accurate.
Hope it helps someone out there!
Go to the bottom of this page in order to see the Legal Stuff
I didn't got this code language but I had see the posters or we can say snapshots given above,it is informative and worth to know.
ReplyDelete