


A complete Gold trading system with positive expectancy. Metatrader Expert Advisor included.
In order to diversify my trading, over the past couple of years I have been researching strategies to effectively trade Gold. Gold is an extremely emotional market that can move several points in a day in one direction, and in the same way it can quickly give it all back. These wild rides, the noise and volatility make it sometimes harder to trade in a discretionary fashion. There is a huge emotional component that ends up hurting Gold traders more often than not. That, and the fact that it is a 24-hour market, makes it more suitable in my opinion for fully automated trading through a robot, a.k.a expert advisor.
At this point, I have developed three Gold trading strategies with a positive edge: a Trend Following strategy, a Volatility based breakout strategy that uses Bollinger Bands and a Counter-trend strategy. In today's article, we'll explore the Trend-Following strategy.
STRATEGY DESIGN
Using pure price action and no indicators, we can determine that Gold is in an uptrend if today's closing price is higher than every closing price over the last X days. We can also say that Gold is in a downtrend if today's closing price is lower than every closing price over the last X days.
I started testing this simple hypothesis with X values between 50 and 120 to determine if there was momentum in favor of the trend, by measuring Maximum Favorable Excursion (MFE) and Maximum Adverse Excursion (MAE) after all the entries. This allowed me to quantify a positive edge. For more information on calculating MFE, MAE, what they represent, etc, read How to measure a system's edge.
I finally settled on 100-day break-outs, as they provide a solid and clear edge. Meaning, if Gold closes today, higher than it has closed in all of the previous 100 days, then it usually has some upside momentum that carries it higher over the next few days. The beauty of this is that, this is not only true for 100-day break outs, but also for 80, 90, 110, 120 and all the values in between. That's to say, we have a reliable entry parameter that just "didn't happen to yield positive returns in the past". If all the surroundings (80, 85, 90, 95, 105, 110, 115, 120), or even some of them had yielded negative results then our 100-day entry rule would not be reliable and we would just be curve-fitting our system to past history, with fewer chances of survival in the future.
After this, I decided to set a Stop Loss at two times the daily range using the Average True Range indicator (ATR). This distance is usually enough to give your trades enough room to work out the noise while at the same time we protect our capital against unlimited risk. 2xATR is a common rule applied by many mechanical trading systems that use the daily time-frame and it was pioneered by the popular Turtles Trading system. A 2xATR move against our original assumption is usually a lost cause. Better to take a manageable loss at that point and move on.
So, now, we have a 100-day breakout entry combined with a standard 2 ATR Stop Loss. Time to think about exits. With the LT Trend Sniper system, we sometimes follow trends for 2 months or more. The Average holding period is 21 days. For this strategy I wanted to do something different. I wanted quicker exits, which is why I thought about a simple time-based exit and started testing automated exits 4 days, 6, 8, 10, 12, 14 days after the entries. All the time based exits showed positive results in the 12 year back-tests performed (2001-2012), which is a great sign. By choosing a simple 10-day time-based exit, we are not choosing a parameter value that just "happened to be" profitable in the past. We are indeed choosing a value in the middle of a sea of profitable possibilities, with good solid returns also in the surroundings to withstand future market mutations. By the way the 10-day exit DOES NOT yield the best returns in the back-test, but it does have a solid neighborhood which is what I like the most about this particular value. There is no guarantee that the parameter value with the greatest return in the past will continue to be the most profitable one in the future. The main concern is always the robustness and future reliability of the system.
In addition to the 10-day exit, the trades are entered with a 2:1 reward to risk ratio. In other words, if during the 10 days of life of the trade, a reward that is twice the risk is achieved, then we will be satisfied and will close the position for a nice profit. Therefore, upon entry, the trade is set with a Target Profit (TP) of 4 times the ATR. So, now we have Stop Loss at 2 x ATR and Target Profit at 4 x ATR. By the way, here, once again, we obtain positive returns regardless of whether we use a 1:1, 2:1 , 3:1 and other reward to risk ratios (3:2, 5:2, etc) , which is again a great sign.
With these simple rules all that was missing was our capital allocation. I wanted to keep a constant risk per trade so that results are not skewed by a few occurrences with greater weight. Because the Stop Loss distance is dynamic, our position size is also going to be dynamically calculated. Meaning, if the Stop Loss distance is small, we can afford a slightly larger position size. However, for larger Stop Loss distances we have to use smaller position sizes. This way we keep a constant risk throughout all the trades. For more information on this, read How to risk a percent of your account per trade.
SYSTEM'S RULES:
Buy GOLD on a 100-day closing high.
Short GOLD on a 100-day closing low.
Stop Loss at 2 x ATR
Target Profit at 4 x ATR
Close the position 10 days after the entry if neither SL nor TP have been hit.
Risk 5% of the account per position. Meaning if SL is hit, the account loses 5 percent. Of course, this risk level can be reduced for more conservative traders.
Never trade two positions at the same time. If a new signal is triggered while in a position, it simply means that the trend is progressing in our favor. We won't increase our capital exposure at that point. Instead, we just ride the original position.
Ok here are the results of this simple, yet effective strategy from January 1, 2001 to December 31, 2012. We are assuming a 0.40 point spread throughout the test. (Most brokers offer better spreads than this nowadays. Anywhere from 0.20 to 0.35 is common). The simulation starts with a $100,000 account balance:
(Click on image to enlarge)
 (Click on image to enlarge)
 Not too shabby. The strategy achieves a +9.83% Average Annual Return, which easily beats the S&P500 Index and the Barclay's Currency Traders Index. The worst draw-down in the equity curve was 19.06% and it took place from October 2008 to February 2009. Of course, by using a smaller than 5% max risk per trade this draw-down can be reduced, but at the expense of also smaller Average Annual Returns. Still, with a 19.06% max draw-down, the strategy easily beats the 55% draw-down suffered by the S&P500 benchmark during the financial melt-down of 2008.
Reducing the magnitude of losses
Despite the positive initial results, we can still explore more approaches to control our draw-downs. For example: Trailing Stop Loss mechanisms. Now, usually, when you bring Stop Losses closer, you expose yourself to getting stopped out more often. As a consequence, you start taking smaller losses BUT more frequently and this may result in a null net effect in many cases or even worse outcomes. For this reason, we must be careful and not trail stop losses too aggressively. We will always keep a 2 x ATR Stop Loss distance, and we will move the Stop Loss by 0.5 ATR whenever the position moves in our favor by 0.5 ATR. For example, if our original Stop Loss distance was 32 Gold Points (ATR = 16), then we will move it by 8 points once the trade has gone in our favor by 8 points and we will keep doing that indefinitely. Once the trade has moved 2 ATRs in our favor, we have moved the Stop Loss four times and it is now at the break-even level, the same price at which we entered the position. As the trend progresses in our favor, we keep trailing the Stop Loss level in 0.5 ATR increments, or 8 Gold Points in this hypothetical case.
Let's look at the results now with the addition of the Trailing Stop Loss mechanism.
(Click on image to enlarge)

This is now a more respectable trading system with very few degrees of freedom and a very low degree of curve-fitting to past data. We have a strong parameters space with many combinations of entry + exits and reward to risk ratios, all of them yielding positive long term results, which speaks of the robustness of this approach and the huge mutations the Gold market would have to endure in order for this simple trending principle to entirely stop working in the future.
How did the system perform in the Out of sample period (January 1, 2013 - January 1, 2016)?
Well, here you are:
(Click on image to enlarge)

Combining both the Back-test and Out Of Sample periods we have 15 years of trading history from January 2001 to January 2016.
(Click on image to enlarge)
 (Click on image to enlarge)
 Beautiful and rather smooth equity curve. The original investment is quadrupled in 15 years, representing a +10.29% Average Annual Return. Max draw-down is 15.94% (closed positions only, not open floating profits or losses). Notice how the Average winner is much larger than the Average Loser and the system wins about 50% of the time, resulting in an excellent 2.01 Profit Factor.
As my free contribution to the trading community, in particular those who specialize in Gold trading, feel free to download the Impatient Sniper (Gold Only) for free.
Exploring Other Instruments
Once the system was entirely conceived, I started to wonder how the strategy would perform in other instruments. Same break-out principle, same 10-day exit, same Stop Loss distance and 2:1 Reward to Risk ratio. It was a very nice surprise to see this system showing solid results in instruments other than Gold. The simple edge it exploits is more universal than I thought.
With the Euro for example, we obtain even better results than with Gold. We have good results whether we trail the Stop Loss or not, and whether we trail it indefinitely or just until the break even level and not beyond. Here is a 16 year back-test from January 1, 2000 to January 1, 2016:
(Click on image to enlarge)
 (Click on image to enlarge)
 Solid +13.94% Annual Return (AAR) with a Maximum Draw-down (MDD) of only 13.60%. A great 1.02 AAR to MDD ratio.
So, now if we want to diversify our risk a little more, we can combine both GOLD and EURO in the same portfolio. GOLD and EURO are not historically strongly correlated instruments. They don't inherently move in the same direction all the time. This is great as it provides us with some built-in risk diversification in a context of a trading strategy with a positive expectancy. By combining both instruments, the draw-downs in one of them can be slightly mitigated by positive results in the other instrument. Of course, we also have the risk of increased draw-downs if they happen to coincide in time.
Here's the GOLD + EUR portfolio. 2000-2016:


Here is the break-down of returns per year:

A 23.37% Average Annual Return is nothing to sneeze at. It turns a $100,000 account into 2.48 millions in 16 years and this is without ever injecting additional fresh capital into the portfolio. It comes however, at the expense of a painful 23.35% draw-down and a period of 536 days during which the portfolio failed to reach new equity highs. It is therefore, a psychologically difficult system to trade. Imagine going through a 20% account draw-down, more than a year without achieving new equity highs and it just looks like you are wasting your time. Profitable trading hurts. For more on that, read my article The Torture.
Personally, I prefer less aggressiveness when trading more than one instrument simultaneously. Using a 3% position size per trade instead of 5% better fits my pain tolerance. This results in still nice +14% Average Annual Returns, but with a much more manageable worst historical draw-down of less than 15%.
The full version (below) allows you to trade the strategy in other symbols in addition to Gold. It also allows you to configure different Stop Loss Trailing modes, and whether or not to add multiple positions simultaneously. As part of the purchase you get the Strategy Description in more detail, the Installation and Configuration guide, plus my personal support setting it all up if needed.
This is a nice example of a simple long term profitable system. I will consider it in my own trading and will follow up on the results at the beginning of every year.
Thanks for reading, and I hope that by studying this system you become a better trader whether you end up using it or not. It might help you explore and develop similar ideas on your own, and if that is the case, I would be glad to hear from you in the future.
Cheers,
LT
Note: I stopped providing technical support for the Impatient Sniper and it is therefore no longer sold. It was a long-term profitable strategy beginning to end, but I decided to get out of the FX Game and programming of Robots, in order to focus attention and resources on other investment vehicles.
Notes:
- Back-tests run assuming a 0.40 Bid-Ask spread in Gold and 2 pip spread for the Euro (0.0002). Both numbers are pretty unfavorable by today's standards.
- The data was purchased at forextester.com and it is 1-minute data. No need to purchase tick by tick history when we are dealing with long term trend following strategies that use distances in the hundreds of pips for both Stop Losses and Target Profits, unlike other strategies such as intra-day, short-term scalpers, where tick data becomes more necessary.
- Back-tests performed on the Metatrader 4 platform, build 950, powered by GoMarkets, an Australian Forex broker regulated by the Australian Securities and Investment Commission (ASIC)
- Portfolio simulations performed through the Asirikuy Draw-Down Analysis Tool, version 1.41a.
- No affiliation whatsoever with any of the previously mentioned sources. They are just enumerated for clarity so that the reader knows exactly where it all came from. No Recommendation.
In order to diversify my trading, over the past couple of years I have been researching strategies to effectively trade Gold. Gold is an extremely emotional market that can move several points in a day in one direction, and in the same way it can quickly give it all back. These wild rides, the noise and volatility make it sometimes harder to trade in a discretionary fashion. There is a huge emotional component that ends up hurting Gold traders more often than not. That, and the fact that it is a 24-hour market, makes it more suitable in my opinion for fully automated trading through a robot, a.k.a expert advisor.
At this point, I have developed three Gold trading strategies with a positive edge: a Trend Following strategy, a Volatility based breakout strategy that uses Bollinger Bands and a Counter-trend strategy. In today's article, we'll explore the Trend-Following strategy.
STRATEGY DESIGN
Using pure price action and no indicators, we can determine that Gold is in an uptrend if today's closing price is higher than every closing price over the last X days. We can also say that Gold is in a downtrend if today's closing price is lower than every closing price over the last X days.
I started testing this simple hypothesis with X values between 50 and 120 to determine if there was momentum in favor of the trend, by measuring Maximum Favorable Excursion (MFE) and Maximum Adverse Excursion (MAE) after all the entries. This allowed me to quantify a positive edge. For more information on calculating MFE, MAE, what they represent, etc, read How to measure a system's edge.
I finally settled on 100-day break-outs, as they provide a solid and clear edge. Meaning, if Gold closes today, higher than it has closed in all of the previous 100 days, then it usually has some upside momentum that carries it higher over the next few days. The beauty of this is that, this is not only true for 100-day break outs, but also for 80, 90, 110, 120 and all the values in between. That's to say, we have a reliable entry parameter that just "didn't happen to yield positive returns in the past". If all the surroundings (80, 85, 90, 95, 105, 110, 115, 120), or even some of them had yielded negative results then our 100-day entry rule would not be reliable and we would just be curve-fitting our system to past history, with fewer chances of survival in the future.
After this, I decided to set a Stop Loss at two times the daily range using the Average True Range indicator (ATR). This distance is usually enough to give your trades enough room to work out the noise while at the same time we protect our capital against unlimited risk. 2xATR is a common rule applied by many mechanical trading systems that use the daily time-frame and it was pioneered by the popular Turtles Trading system. A 2xATR move against our original assumption is usually a lost cause. Better to take a manageable loss at that point and move on.
So, now, we have a 100-day breakout entry combined with a standard 2 ATR Stop Loss. Time to think about exits. With the LT Trend Sniper system, we sometimes follow trends for 2 months or more. The Average holding period is 21 days. For this strategy I wanted to do something different. I wanted quicker exits, which is why I thought about a simple time-based exit and started testing automated exits 4 days, 6, 8, 10, 12, 14 days after the entries. All the time based exits showed positive results in the 12 year back-tests performed (2001-2012), which is a great sign. By choosing a simple 10-day time-based exit, we are not choosing a parameter value that just "happened to be" profitable in the past. We are indeed choosing a value in the middle of a sea of profitable possibilities, with good solid returns also in the surroundings to withstand future market mutations. By the way the 10-day exit DOES NOT yield the best returns in the back-test, but it does have a solid neighborhood which is what I like the most about this particular value. There is no guarantee that the parameter value with the greatest return in the past will continue to be the most profitable one in the future. The main concern is always the robustness and future reliability of the system.
In addition to the 10-day exit, the trades are entered with a 2:1 reward to risk ratio. In other words, if during the 10 days of life of the trade, a reward that is twice the risk is achieved, then we will be satisfied and will close the position for a nice profit. Therefore, upon entry, the trade is set with a Target Profit (TP) of 4 times the ATR. So, now we have Stop Loss at 2 x ATR and Target Profit at 4 x ATR. By the way, here, once again, we obtain positive returns regardless of whether we use a 1:1, 2:1 , 3:1 and other reward to risk ratios (3:2, 5:2, etc) , which is again a great sign.
With these simple rules all that was missing was our capital allocation. I wanted to keep a constant risk per trade so that results are not skewed by a few occurrences with greater weight. Because the Stop Loss distance is dynamic, our position size is also going to be dynamically calculated. Meaning, if the Stop Loss distance is small, we can afford a slightly larger position size. However, for larger Stop Loss distances we have to use smaller position sizes. This way we keep a constant risk throughout all the trades. For more information on this, read How to risk a percent of your account per trade.
SYSTEM'S RULES:
Buy GOLD on a 100-day closing high.
Short GOLD on a 100-day closing low.
Stop Loss at 2 x ATR
Target Profit at 4 x ATR
Close the position 10 days after the entry if neither SL nor TP have been hit.
Risk 5% of the account per position. Meaning if SL is hit, the account loses 5 percent. Of course, this risk level can be reduced for more conservative traders.
Never trade two positions at the same time. If a new signal is triggered while in a position, it simply means that the trend is progressing in our favor. We won't increase our capital exposure at that point. Instead, we just ride the original position.
Ok here are the results of this simple, yet effective strategy from January 1, 2001 to December 31, 2012. We are assuming a 0.40 point spread throughout the test. (Most brokers offer better spreads than this nowadays. Anywhere from 0.20 to 0.35 is common). The simulation starts with a $100,000 account balance:
(Click on image to enlarge)


Reducing the magnitude of losses
Despite the positive initial results, we can still explore more approaches to control our draw-downs. For example: Trailing Stop Loss mechanisms. Now, usually, when you bring Stop Losses closer, you expose yourself to getting stopped out more often. As a consequence, you start taking smaller losses BUT more frequently and this may result in a null net effect in many cases or even worse outcomes. For this reason, we must be careful and not trail stop losses too aggressively. We will always keep a 2 x ATR Stop Loss distance, and we will move the Stop Loss by 0.5 ATR whenever the position moves in our favor by 0.5 ATR. For example, if our original Stop Loss distance was 32 Gold Points (ATR = 16), then we will move it by 8 points once the trade has gone in our favor by 8 points and we will keep doing that indefinitely. Once the trade has moved 2 ATRs in our favor, we have moved the Stop Loss four times and it is now at the break-even level, the same price at which we entered the position. As the trend progresses in our favor, we keep trailing the Stop Loss level in 0.5 ATR increments, or 8 Gold Points in this hypothetical case.
Let's look at the results now with the addition of the Trailing Stop Loss mechanism.
(Click on image to enlarge)

(Click on image to enlarge) 
A much nicer equity curve now and improved statistics. Average Annual Return is now +10.94% and the Max Draw-down ever suffered is 15.94%. (Meta-trader over-estimates it with 18.17% because it assumes higher equity peaks and larger losses as it considers open positions' balances). My preference is to only consider closed positions in the results.
This is now a more respectable trading system with very few degrees of freedom and a very low degree of curve-fitting to past data. We have a strong parameters space with many combinations of entry + exits and reward to risk ratios, all of them yielding positive long term results, which speaks of the robustness of this approach and the huge mutations the Gold market would have to endure in order for this simple trending principle to entirely stop working in the future.
How did the system perform in the Out of sample period (January 1, 2013 - January 1, 2016)?
Well, here you are:
(Click on image to enlarge)

(Click on image to enlarge) 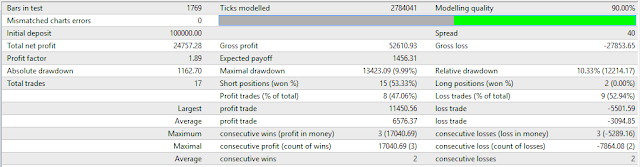
In the three-year Out of Sample period, the account grows +25% and behaves within the expected parameters. This is important, because this period was not taken into account at all during the initial design of the strategy. In other words, this is Gold data that the system had never seen before and it is what would have resulted from trading the strategy live during those 3 years.
Combining both the Back-test and Out Of Sample periods we have 15 years of trading history from January 2001 to January 2016.
(Click on image to enlarge)
 (Click on image to enlarge)
As my free contribution to the trading community, in particular those who specialize in Gold trading, feel free to download the Impatient Sniper (Gold Only) for free.
LT Impatient Sniper (Gold Only)
Expert Advisor for Metatrader
Strategy design, Back-tests and Configuration Guide
Free Download
Expert Advisor for Metatrader
Strategy design, Back-tests and Configuration Guide
Free Download
Exploring Other Instruments
Once the system was entirely conceived, I started to wonder how the strategy would perform in other instruments. Same break-out principle, same 10-day exit, same Stop Loss distance and 2:1 Reward to Risk ratio. It was a very nice surprise to see this system showing solid results in instruments other than Gold. The simple edge it exploits is more universal than I thought.
With the Euro for example, we obtain even better results than with Gold. We have good results whether we trail the Stop Loss or not, and whether we trail it indefinitely or just until the break even level and not beyond. Here is a 16 year back-test from January 1, 2000 to January 1, 2016:
(Click on image to enlarge)


So, now if we want to diversify our risk a little more, we can combine both GOLD and EURO in the same portfolio. GOLD and EURO are not historically strongly correlated instruments. They don't inherently move in the same direction all the time. This is great as it provides us with some built-in risk diversification in a context of a trading strategy with a positive expectancy. By combining both instruments, the draw-downs in one of them can be slightly mitigated by positive results in the other instrument. Of course, we also have the risk of increased draw-downs if they happen to coincide in time.
Here's the GOLD + EUR portfolio. 2000-2016:
Here is the break-down of returns per year:
A 23.37% Average Annual Return is nothing to sneeze at. It turns a $100,000 account into 2.48 millions in 16 years and this is without ever injecting additional fresh capital into the portfolio. It comes however, at the expense of a painful 23.35% draw-down and a period of 536 days during which the portfolio failed to reach new equity highs. It is therefore, a psychologically difficult system to trade. Imagine going through a 20% account draw-down, more than a year without achieving new equity highs and it just looks like you are wasting your time. Profitable trading hurts. For more on that, read my article The Torture.
Personally, I prefer less aggressiveness when trading more than one instrument simultaneously. Using a 3% position size per trade instead of 5% better fits my pain tolerance. This results in still nice +14% Average Annual Returns, but with a much more manageable worst historical draw-down of less than 15%.
The full version (below) allows you to trade the strategy in other symbols in addition to Gold. It also allows you to configure different Stop Loss Trailing modes, and whether or not to add multiple positions simultaneously. As part of the purchase you get the Strategy Description in more detail, the Installation and Configuration guide, plus my personal support setting it all up if needed.
This is a nice example of a simple long term profitable system. I will consider it in my own trading and will follow up on the results at the beginning of every year.
Thanks for reading, and I hope that by studying this system you become a better trader whether you end up using it or not. It might help you explore and develop similar ideas on your own, and if that is the case, I would be glad to hear from you in the future.
Cheers,
LT
Note: I stopped providing technical support for the Impatient Sniper and it is therefore no longer sold. It was a long-term profitable strategy beginning to end, but I decided to get out of the FX Game and programming of Robots, in order to focus attention and resources on other investment vehicles.
Notes:
- Back-tests run assuming a 0.40 Bid-Ask spread in Gold and 2 pip spread for the Euro (0.0002). Both numbers are pretty unfavorable by today's standards.
- The data was purchased at forextester.com and it is 1-minute data. No need to purchase tick by tick history when we are dealing with long term trend following strategies that use distances in the hundreds of pips for both Stop Losses and Target Profits, unlike other strategies such as intra-day, short-term scalpers, where tick data becomes more necessary.
- Back-tests performed on the Metatrader 4 platform, build 950, powered by GoMarkets, an Australian Forex broker regulated by the Australian Securities and Investment Commission (ASIC)
- Portfolio simulations performed through the Asirikuy Draw-Down Analysis Tool, version 1.41a.
- No affiliation whatsoever with any of the previously mentioned sources. They are just enumerated for clarity so that the reader knows exactly where it all came from. No Recommendation.
Go to the bottom of this page in order to see the Legal Stuff
No comments:
Post a Comment