


In the first part of this series
we examined the viability of investing in triple leveraged SPX via
UPRO, combined with bonds. We saw the viability of a simple combination of one third of an account holding
UPRO (basically attempting to match the markets returns on the whole)
combined with another instrument with a historical upside bias such as
Bonds (TLT) which, additionally offers hedging potential as it generally
moves up in times of crises (UPRO going down) easily beat the market
(18.17% annual return vs 13.37% SPY) since 2011.
In the second part of the series we looked at short volatility instruments, such as XIV and ZIV. Unlike UPRO, they tend to go up when the market is going sideways. Combinations of either XIV or ZIV with bonds easily beat the markets too, but it was a pretty volatile ride, especially for XIV, which I personally prefer to not be invested in.
In the third part of the series, we analyzed the combinations of Triple leveraged S&Ps, Short Volatility and Triple Leveraged bonds. All in the same portfolio. The results looked attractive, in the 20% to 35% annual return range with better return to risk ratios than simply holding the SPX Index via SPY even with its dividends and all.
The question remains though: How would these portfolios have performed during a serious market correction? Back in 2008 these instruments didn't exist but common sense tells us that triple leveraged SPX (UPRO) and short Volatility (ZIV or XIV) would have suffered massive, unbearable declines. So, is this whole idea worth our time?
To answer that question, I first needed the simulated data. The hypothetical prices of these instruments back when they didn't exist. This is how I obtained it:
1- UPRO data (Triple Leveraged SPX) was a simple calculation I made in Excel. Daily closing prices of SPX were downloaded from Yahoo Finance going far back enough, and then I added a formula that calculated the daily return of SPX (close to close day after day). Then I added another formula on a separate column that would triple that percentage value of daily gain or loss and figured out the hypothetical UPRO values from there. In practice, now that UPRO exists, it doesn't always track an exact 3x daily return. Sometimes it does 3.01x, or 2.98x, etc. But it gets pretty close to 3. So, I figured using this approach for hypothetical past values was "fair game" and would not distort the simulations too much.
2- TMF data (Triple leveraged Bonds), I did the same thing but using TLT data. Again, I think this is a valid approach and not excessively far from what would have happened in reality.
3- ZIV data* (Short medium-term volatility). The pricing algorithm for this instrument is public. It is possible to generate ZIV values from the distant past. However, it is not as easy to figure out as UPRO or TMF. I decided to avoid the headaches after a while and purchased the data from SixFigureInvesting.com. By the way, excellent website and the best one I have found that deeply discusses volatility instruments. So, I paid the bucks, got my daily data and was ready to rock.
The PAIN
. UPRO would have fallen from a 73.8 high on JULY 13, 2007 to a 3.16 low on MAR 9, 2009. That's an extremely painful and "bearable by nobody" fall of -95.7% over 20 months.
. ZIV would have fallen from its highest point of 46.5794 on APR 17, 2007 down to 9.33 on DEC 11, 2008. A cruel 80% fall over 19 months.
The SAVIOUR
. Bonds did extremely well during 2008. Looking at this summary from MorningStar TLT was up +33.92% in 2008. But that's the traditional version. The leveraged version (TMF) would have been up +152.43%!!! Remember that over periods of time longer than a day, the returns do not align 3 to 1 on the leveraged version (Read part 1).
The addition of Triple leveraged bonds would have resulted in much more tolerable results during the financial crisis. Remember, there is an annual re-balance at the beginning of every year to take the allocations (%) back to the original levels:
(Click on image to enlarge)

*2017 Results compiled up to November 10.
Very interesting results here. Hey look at that! our old friend 33 UPRO / 66 TLT (33.3% invested in UPRO & 66.6% of the account invested in TLT) would have had a not so terrible 2008, losing only 6.10% by the end of the year. This simple approach shows a 14.24% average annual return including the financial crisis vs 9.82% SPY and that, with a smaller standard deviation and better Annual Return to Std Dev ratio!
There are interesting combinations here, but focusing on those with the best AVG/StdDev ratio and returns above 20% on average per year, we have:
- 30 UPRO / 30 ZIV / 40 TMF (My favorite)
- 33 UPRO / 33 ZIV / 33 TMF
- 60 UPRO / 40 TMF. The traditional 60/40 portfolio but on steroids. This is a good combination but perhaps a bit too volatile for me.
Even though 2008 was not bad for these portfolios, there is one thing this cold table doesn't reveal and it is the fact that "the ride" was not easy. In fact, it was very painful and would have put anyone under a serious test of confidence. Remember that in 2008 Bonds only started to go seriously up by November. Granted, they truly exploded, but before that, they were not exactly killing it. So, I wanted to see on a daily basis, how deep the draw-downs of the overall portfolios would have looked:
(Click on image to enlarge)
 30 UPRO /30 ZIV/40 TMF Portfolio suffered a worst draw-down of -42.5% during the financial crisis.
(Click on image to enlarge)
 33 UPRO /33 ZIV/33 TMF Portfolio had a worst draw-down of -49.2%.
Max draw-downs above 40% are tough to swallow. No doubt. But remember, the S&P's draw-down was 50%. So, even in this difficult scenario the portfolios did slightly better.
Also worth noting is, how volatile these portfolios were in 2015 and part of 2016. Years of no particularly huge corrections. Just some back and forth and a flat 2015. Another indication that riding these will not be a walk on the park.
Up to this point, I think I have solid evidence that these kind of portfolios are a superior approach to holding SPY. They absolutely destroy SPY in terms of annual returns, and easily beat it too regarding Return to Volatility ratios. Draw-down wise, they may suffer as much as a pure index holder. Keep in mind though, that if these strategies are used in taxable accounts, the annual re-balancing will trigger taxable events. Still, the returns are so superior, that even then the portfolios would come out ahead.
A few readers have approached me during the writing of the series, suggesting some tests and offering very valuable ideas. Let's talk about some of them.
Monthly re-balance with a 200 DMA filter rule
In other words, re-balancing every month instead of annually and using a 200 Day Moving Average filter on each instrument. If the instrument was below the 200 DMA at the time of re-balancing, its corresponding portion of the capital would go to cash.
(Click on image to enlarge)
 You certainly avoid the 2008 draw-down like a wizard. But then, you sacrifice too much by not being invested at the time of rebounds in other years. Notice that the filter rule does not totally protect you from significant draw-downs. There is a 24.3% draw-down from February to December 2015. This approach obtained a 21.05% average annual return with a standard deviation of 22.01 and a Return to Deviation ratio of 0.96.
Allocating 10% of the portfolio to Long Volatility (VXZ)
Note: I purchased VXZ data from the same website mentioned earlier SixFigureInvesting.com
In the long-run being long volatility is a losing bet. It will be a drag, but the thinking here is that maybe, by drastically reducing the draw-downs, we come out on top at the end.
(Click on image to enlarge)
 Without VXZ in the mix the absolute returns are better than with it. This idea however has some merit because the pain in the equity curve is greatly reduced. The worst draw-down in this case (with VXZ included) is only -17% and that's a great result, considering the annual return here is a still very respectable +18%. Keep in mind that for almost two years: late 2014 to late 2016, the portfolio goes nowhere. That's usually the kind of time-frame where most people would have given up and abandoned the strategy.
Quarterly Re-balance:
I had high hopes with this one. Instead of re-balancing annually, you do it every three months: at the end of March, June, September and December. As it turns out, over at EtfReplay.com (where I also purchased a premium membership) this is the best approach for re-balancing, generally boosting annual returns by 1% or 2% in different portfolios while reducing the worst draw-downs by 3% to 5%. There is a problem though: EtfReplay only has post-2011 data for ZIV and not our simulated data from earlier years. So, I had to run my own tests on Excel to see how the really tough periods would have looked.
(Click on image to enlarge)
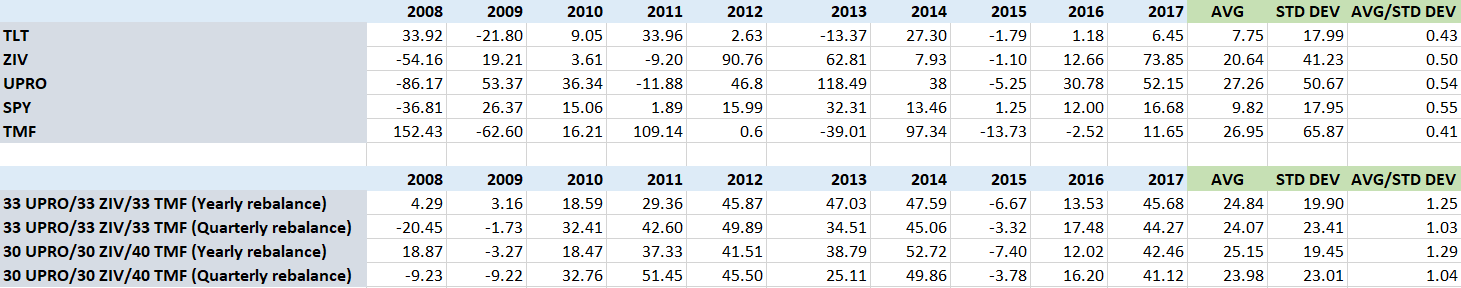 Well, I think this makes it clear. In the very long run, re-balancing every 3 months is not a better approach. In fact it is inferior! For some reason this surprised me. But the numbers don't lie. Also the draw-downs during the financial crisis became worse, surpassing 50% in all cases and actually closer to 60%. Because all three instruments (UPRO, ZIV, UPRO) have a historical upside bias, it seems to be the case that trying to time entries and exists is pointless and the best defense is to just keep the allocations in check at the beginning of each year.
CONCLUSIONS
1. Forget about pundits' dogma that you must not invest on leveraged or short volatility instruments for long periods of time. BS. You can do it, and in fact by doing so you will easily beat market returns. You just have to be smart about it and combine them appropriately.
2. You will typically beat the market but you may experience deep draw-downs, similar to those of the S&P500.
3. The ride will not be easy. Draw-downs will exist and they will be significant. Also, patience will be tested when a couple of years go by where the portfolio goes nowhere.
4. Adding a long volatility component into the mix (VXZ or TVIX) will be a long term drag to the returns, but it will make the ride smoother. This may be very useful on a large balance, but will be pointless in a small account.
5. In the long run, re-balancing more frequently does not seem to be a superior approach. It may work in your favor some years, but doesn't seem to be productive in the long run.
6. Re-balancing triggers taxable events not suffered by the pure buy-holder. This is a non-issue in registered accounts like ROTH IRA and Regular IRA. In taxable accounts, if you are in your accumulation phase, you can re-balance without triggering taxable events, simply allocating the new capital injections in such a way that the final holdings meet your allocation criteria. So, no selling is necessary.
7. Finally, remember the instruments' fees, which were not taken into account during these tests. For ZIV, UPRO and TMF they are around 1% per year for your whole portfolio.
ZIV and VXZ data*: Because I purchased this data from Vance Harwood's brilliant SixFigureInvesting site, sharing my Excel files would mean giving away his work for free. Even though my Excel tests are focused on portfolio results, the ZIV data points, result of his hours of effort, are obviously included for the simulations and it would affect his site's source of income. For this reason, I am not freely sharing my Excel files as I typically do, under the WTFPL License (Wikipedia link for enlightenment). That being said, if you show me a receipt that you purchased ZIV and VXZ data from him, I have no problem sending you my Excel files with all the portfolio tests. Just shoot me an email.
I hope you enjoyed this series.
It was certainly entertaining and enlightening to me.
Starting in 2018 I will invest $10,000 of my own money on a 30UPRO/30ZIV/40TMF portfolio which I will re-balance annually.
Cheers,
LT
Note*: Putting this series together took some significant effort in time (around 25 hours of effort over two months) and money spent purchasing data and premium memberships (ETFReplay). Yet, it gets to you entirely free. I'm not sure what exactly that says about me, but, for now, do your pal LT a solid and share the goodwill. Share the article if you think others may find it interesting. It's all I ask. Much appreciated!
You can follow me on Twitter@lazytrading
Related Articles:
Volatility and Leveraged instruments to Lazily beat the markets (Part 1)
Volatility and Leveraged instruments to Lazily beat the markets (Part 2)
Volatility and Leveraged instruments to Lazily beat the markets (Part 3)
In the second part of the series we looked at short volatility instruments, such as XIV and ZIV. Unlike UPRO, they tend to go up when the market is going sideways. Combinations of either XIV or ZIV with bonds easily beat the markets too, but it was a pretty volatile ride, especially for XIV, which I personally prefer to not be invested in.
In the third part of the series, we analyzed the combinations of Triple leveraged S&Ps, Short Volatility and Triple Leveraged bonds. All in the same portfolio. The results looked attractive, in the 20% to 35% annual return range with better return to risk ratios than simply holding the SPX Index via SPY even with its dividends and all.
The question remains though: How would these portfolios have performed during a serious market correction? Back in 2008 these instruments didn't exist but common sense tells us that triple leveraged SPX (UPRO) and short Volatility (ZIV or XIV) would have suffered massive, unbearable declines. So, is this whole idea worth our time?
To answer that question, I first needed the simulated data. The hypothetical prices of these instruments back when they didn't exist. This is how I obtained it:
1- UPRO data (Triple Leveraged SPX) was a simple calculation I made in Excel. Daily closing prices of SPX were downloaded from Yahoo Finance going far back enough, and then I added a formula that calculated the daily return of SPX (close to close day after day). Then I added another formula on a separate column that would triple that percentage value of daily gain or loss and figured out the hypothetical UPRO values from there. In practice, now that UPRO exists, it doesn't always track an exact 3x daily return. Sometimes it does 3.01x, or 2.98x, etc. But it gets pretty close to 3. So, I figured using this approach for hypothetical past values was "fair game" and would not distort the simulations too much.
2- TMF data (Triple leveraged Bonds), I did the same thing but using TLT data. Again, I think this is a valid approach and not excessively far from what would have happened in reality.
3- ZIV data* (Short medium-term volatility). The pricing algorithm for this instrument is public. It is possible to generate ZIV values from the distant past. However, it is not as easy to figure out as UPRO or TMF. I decided to avoid the headaches after a while and purchased the data from SixFigureInvesting.com. By the way, excellent website and the best one I have found that deeply discusses volatility instruments. So, I paid the bucks, got my daily data and was ready to rock.
The PAIN
. UPRO would have fallen from a 73.8 high on JULY 13, 2007 to a 3.16 low on MAR 9, 2009. That's an extremely painful and "bearable by nobody" fall of -95.7% over 20 months.
. ZIV would have fallen from its highest point of 46.5794 on APR 17, 2007 down to 9.33 on DEC 11, 2008. A cruel 80% fall over 19 months.
The SAVIOUR
. Bonds did extremely well during 2008. Looking at this summary from MorningStar TLT was up +33.92% in 2008. But that's the traditional version. The leveraged version (TMF) would have been up +152.43%!!! Remember that over periods of time longer than a day, the returns do not align 3 to 1 on the leveraged version (Read part 1).
The addition of Triple leveraged bonds would have resulted in much more tolerable results during the financial crisis. Remember, there is an annual re-balance at the beginning of every year to take the allocations (%) back to the original levels:
(Click on image to enlarge)
*2017 Results compiled up to November 10.
Very interesting results here. Hey look at that! our old friend 33 UPRO / 66 TLT (33.3% invested in UPRO & 66.6% of the account invested in TLT) would have had a not so terrible 2008, losing only 6.10% by the end of the year. This simple approach shows a 14.24% average annual return including the financial crisis vs 9.82% SPY and that, with a smaller standard deviation and better Annual Return to Std Dev ratio!
There are interesting combinations here, but focusing on those with the best AVG/StdDev ratio and returns above 20% on average per year, we have:
- 30 UPRO / 30 ZIV / 40 TMF (My favorite)
- 33 UPRO / 33 ZIV / 33 TMF
- 60 UPRO / 40 TMF. The traditional 60/40 portfolio but on steroids. This is a good combination but perhaps a bit too volatile for me.
Even though 2008 was not bad for these portfolios, there is one thing this cold table doesn't reveal and it is the fact that "the ride" was not easy. In fact, it was very painful and would have put anyone under a serious test of confidence. Remember that in 2008 Bonds only started to go seriously up by November. Granted, they truly exploded, but before that, they were not exactly killing it. So, I wanted to see on a daily basis, how deep the draw-downs of the overall portfolios would have looked:
(Click on image to enlarge)

(Click on image to enlarge)

Max draw-downs above 40% are tough to swallow. No doubt. But remember, the S&P's draw-down was 50%. So, even in this difficult scenario the portfolios did slightly better.
Also worth noting is, how volatile these portfolios were in 2015 and part of 2016. Years of no particularly huge corrections. Just some back and forth and a flat 2015. Another indication that riding these will not be a walk on the park.
Up to this point, I think I have solid evidence that these kind of portfolios are a superior approach to holding SPY. They absolutely destroy SPY in terms of annual returns, and easily beat it too regarding Return to Volatility ratios. Draw-down wise, they may suffer as much as a pure index holder. Keep in mind though, that if these strategies are used in taxable accounts, the annual re-balancing will trigger taxable events. Still, the returns are so superior, that even then the portfolios would come out ahead.
========================================
A few readers have approached me during the writing of the series, suggesting some tests and offering very valuable ideas. Let's talk about some of them.
Monthly re-balance with a 200 DMA filter rule
In other words, re-balancing every month instead of annually and using a 200 Day Moving Average filter on each instrument. If the instrument was below the 200 DMA at the time of re-balancing, its corresponding portion of the capital would go to cash.
(Click on image to enlarge)

Allocating 10% of the portfolio to Long Volatility (VXZ)
Note: I purchased VXZ data from the same website mentioned earlier SixFigureInvesting.com
In the long-run being long volatility is a losing bet. It will be a drag, but the thinking here is that maybe, by drastically reducing the draw-downs, we come out on top at the end.
(Click on image to enlarge)

Quarterly Re-balance:
I had high hopes with this one. Instead of re-balancing annually, you do it every three months: at the end of March, June, September and December. As it turns out, over at EtfReplay.com (where I also purchased a premium membership) this is the best approach for re-balancing, generally boosting annual returns by 1% or 2% in different portfolios while reducing the worst draw-downs by 3% to 5%. There is a problem though: EtfReplay only has post-2011 data for ZIV and not our simulated data from earlier years. So, I had to run my own tests on Excel to see how the really tough periods would have looked.
(Click on image to enlarge)
CONCLUSIONS
1. Forget about pundits' dogma that you must not invest on leveraged or short volatility instruments for long periods of time. BS. You can do it, and in fact by doing so you will easily beat market returns. You just have to be smart about it and combine them appropriately.
2. You will typically beat the market but you may experience deep draw-downs, similar to those of the S&P500.
3. The ride will not be easy. Draw-downs will exist and they will be significant. Also, patience will be tested when a couple of years go by where the portfolio goes nowhere.
4. Adding a long volatility component into the mix (VXZ or TVIX) will be a long term drag to the returns, but it will make the ride smoother. This may be very useful on a large balance, but will be pointless in a small account.
5. In the long run, re-balancing more frequently does not seem to be a superior approach. It may work in your favor some years, but doesn't seem to be productive in the long run.
6. Re-balancing triggers taxable events not suffered by the pure buy-holder. This is a non-issue in registered accounts like ROTH IRA and Regular IRA. In taxable accounts, if you are in your accumulation phase, you can re-balance without triggering taxable events, simply allocating the new capital injections in such a way that the final holdings meet your allocation criteria. So, no selling is necessary.
7. Finally, remember the instruments' fees, which were not taken into account during these tests. For ZIV, UPRO and TMF they are around 1% per year for your whole portfolio.
ZIV and VXZ data*: Because I purchased this data from Vance Harwood's brilliant SixFigureInvesting site, sharing my Excel files would mean giving away his work for free. Even though my Excel tests are focused on portfolio results, the ZIV data points, result of his hours of effort, are obviously included for the simulations and it would affect his site's source of income. For this reason, I am not freely sharing my Excel files as I typically do, under the WTFPL License (Wikipedia link for enlightenment). That being said, if you show me a receipt that you purchased ZIV and VXZ data from him, I have no problem sending you my Excel files with all the portfolio tests. Just shoot me an email.
I hope you enjoyed this series.
It was certainly entertaining and enlightening to me.
Starting in 2018 I will invest $10,000 of my own money on a 30UPRO/30ZIV/40TMF portfolio which I will re-balance annually.
Cheers,
LT
Note*: Putting this series together took some significant effort in time (around 25 hours of effort over two months) and money spent purchasing data and premium memberships (ETFReplay). Yet, it gets to you entirely free. I'm not sure what exactly that says about me, but, for now, do your pal LT a solid and share the goodwill. Share the article if you think others may find it interesting. It's all I ask. Much appreciated!
You can follow me on Twitter
Volatility and Leveraged instruments to Lazily beat the markets (Part 1)
Volatility and Leveraged instruments to Lazily beat the markets (Part 2)
Volatility and Leveraged instruments to Lazily beat the markets (Part 3)
Go to the bottom of this page in order to see the Legal Stuff
No comments:
Post a Comment