


Well, September expiration is in the books and I saw the following positions expire for max profit:
RUT 1330/1340 Credit Call spread
RUT 900/910 Credit Put spread
SPX 1650/1675 Credit Put spread
This would have resulted in a 5.75% draw-down for the month, but I had an additional little loser:
SPY long 147 Put.
This long Put idea was an insurance play, bought just in case the market kept crashing. A small price to pay for piece of mind in the middle of the debacle.
So, in the end, September brought a 6.16% draw-down with trading costs included. The track record has already been updated. The market is now down 4.70% for the year while the model portfolio is up 11.93%. It's good to finally be done with September and be able to focus on brand new positions for the rest of the year. My goal of a +30% return for the year will not be achieved, but there is just so much risk you can take before blowing up. Had I not made adjustments to my trades I would have ended up making a lot of money in the September cycle, as the market rebounded immediately after the crash. But what if? what if I hadn't defended the positions and the market ended up truly crashing? That's the risk I never want to take. So, when you see a credit spread trading newsletter out there showing a 50% return for the year, don't just look at the number in black and white. Dig a little deeper. Look at how positions are defended (if at all). Assess how responsible or sustainable the trading method is. Ask yourself what will the results be during really violent market moves? Most Credit Spreads/Iron Condor newsletters that show 40% - 60% annual returns, in fact all of them, eventually blow up as they delay their adjustments way too much, and in many cases just refuse to defend their positions at all when price penetrates their strike prices. Refusing to acknowledge failure by taking a loss they just start "hoping" for a market reversal. At that point it becomes gambling more than anything. It may not happen in a year or two, or three. You will enjoy 60% annual returns, until, one day, you inevitably end up with an 80% draw-down, and all is gone, forever.
Market conditions
This week the SPX went from 1963.06 to 1958.03. Negligible move. The Fed didn't move interest rates and I won't talk about the implications of that as it is a useless exercise. Neither will I base my trading on correctly predicting whether rates will be increased in October or never again in our lifetime.
This week I also started to trade the November cycle via a 1630/1640/2100/2110 SPX Iron Condor
and I also tried to execute an SPX October 2100/2105 Credit Call spread whose fill I never got.
A Chart of the SPX and the current levels of interest to me.
(Click on image to enlarge)
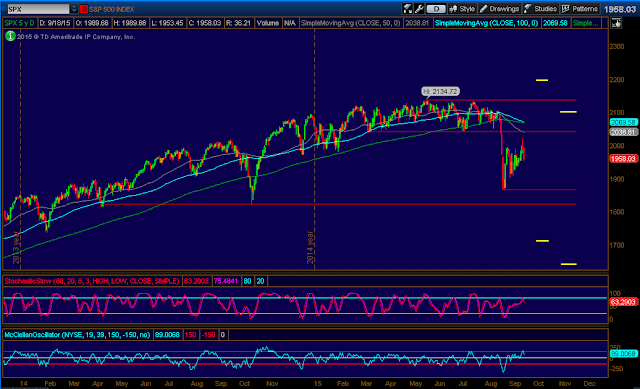 Stochastics: 63 (neutral)
McClellan: +89 (neutral)
Number of stocks above their 20 Day Moving Average: 57% (neutral)
Support: 1820, 1865
Resistance: 2040, 2135
No man's land here, and with an elevated VIX it is the ideal scenario for Iron Condors, reason why I opened one yesterday. Notice how I removed the old uptrend channel that had been in play for so long. Now I'm more focused on sideways action and horizontal price levels.
October positions
SPX 1700/1710/2195/2200 unbalanced Iron Condor
Looking great. 95% probability of success at expiration. Plenty of room from the current SPX price (1958) to either side of the position. I won't touch it.
November positions
SPX 1630/1640/2100/2110 Iron Condor
This is the position initiated yesterday. Not much to talk about here, just lots of baby-sitting time ahead.
Action Plan for the week
For now I will just ride the two Iron Condors. Both are safe and I will let that Theta Decay work for me for a while.
As for new trades, I'm not done with the October cycle. If we get an extreme price condition I will use RUT October options. This is what I'm looking at with RUT. Notice that I also removed old uptrend lines.
(Click on image to enlarge)
 If we reach an extreme pessimistic reading, I want to sell Puts below all those horizontal lines. With a 3% or 4% decline this week, selling an October RUT Credit Put spread in the mid 900's will be a nice trade for a nice premium (0.60 or better), with little time to expiration.
If we see strength, I'm talking about revisiting the recent 1193 high, selling the 1250/1260 Credit Call spread would be an interesting play, looking for a credit greater than 1.00. Also using October options.
We're talking about plus 3% moves in both cases which is not typical for just a week of market action. If no short term extreme price action takes place, I will simply refrain from adding new positions.
Economic Calendar
Monday: US Existing Home Sales
Tuesday: German PMI, Europe's Manufacturing and Services PMI. US Crude Oil Inventories.
Wednesday: Durable Goods Orders, New Home Sales
Thursday: US GDP, Services PMI, Michigan Consumer Sentiment
Friday: US Personal Spending and Pending Home Sales
Good luck this week folks!
Check out 2015 Track Record
RUT 1330/1340 Credit Call spread
RUT 900/910 Credit Put spread
SPX 1650/1675 Credit Put spread
This would have resulted in a 5.75% draw-down for the month, but I had an additional little loser:
SPY long 147 Put.
This long Put idea was an insurance play, bought just in case the market kept crashing. A small price to pay for piece of mind in the middle of the debacle.
So, in the end, September brought a 6.16% draw-down with trading costs included. The track record has already been updated. The market is now down 4.70% for the year while the model portfolio is up 11.93%. It's good to finally be done with September and be able to focus on brand new positions for the rest of the year. My goal of a +30% return for the year will not be achieved, but there is just so much risk you can take before blowing up. Had I not made adjustments to my trades I would have ended up making a lot of money in the September cycle, as the market rebounded immediately after the crash. But what if? what if I hadn't defended the positions and the market ended up truly crashing? That's the risk I never want to take. So, when you see a credit spread trading newsletter out there showing a 50% return for the year, don't just look at the number in black and white. Dig a little deeper. Look at how positions are defended (if at all). Assess how responsible or sustainable the trading method is. Ask yourself what will the results be during really violent market moves? Most Credit Spreads/Iron Condor newsletters that show 40% - 60% annual returns, in fact all of them, eventually blow up as they delay their adjustments way too much, and in many cases just refuse to defend their positions at all when price penetrates their strike prices. Refusing to acknowledge failure by taking a loss they just start "hoping" for a market reversal. At that point it becomes gambling more than anything. It may not happen in a year or two, or three. You will enjoy 60% annual returns, until, one day, you inevitably end up with an 80% draw-down, and all is gone, forever.
Market conditions
This week the SPX went from 1963.06 to 1958.03. Negligible move. The Fed didn't move interest rates and I won't talk about the implications of that as it is a useless exercise. Neither will I base my trading on correctly predicting whether rates will be increased in October or never again in our lifetime.
This week I also started to trade the November cycle via a 1630/1640/2100/2110 SPX Iron Condor
and I also tried to execute an SPX October 2100/2105 Credit Call spread whose fill I never got.
A Chart of the SPX and the current levels of interest to me.
(Click on image to enlarge)

McClellan: +89 (neutral)
Number of stocks above their 20 Day Moving Average: 57% (neutral)
Support: 1820, 1865
Resistance: 2040, 2135
No man's land here, and with an elevated VIX it is the ideal scenario for Iron Condors, reason why I opened one yesterday. Notice how I removed the old uptrend channel that had been in play for so long. Now I'm more focused on sideways action and horizontal price levels.
October positions
SPX 1700/1710/2195/2200 unbalanced Iron Condor
Looking great. 95% probability of success at expiration. Plenty of room from the current SPX price (1958) to either side of the position. I won't touch it.
November positions
SPX 1630/1640/2100/2110 Iron Condor
This is the position initiated yesterday. Not much to talk about here, just lots of baby-sitting time ahead.
Action Plan for the week
For now I will just ride the two Iron Condors. Both are safe and I will let that Theta Decay work for me for a while.
As for new trades, I'm not done with the October cycle. If we get an extreme price condition I will use RUT October options. This is what I'm looking at with RUT. Notice that I also removed old uptrend lines.
(Click on image to enlarge)

If we see strength, I'm talking about revisiting the recent 1193 high, selling the 1250/1260 Credit Call spread would be an interesting play, looking for a credit greater than 1.00. Also using October options.
We're talking about plus 3% moves in both cases which is not typical for just a week of market action. If no short term extreme price action takes place, I will simply refrain from adding new positions.
Economic Calendar
Monday: US Existing Home Sales
Tuesday: German PMI, Europe's Manufacturing and Services PMI. US Crude Oil Inventories.
Wednesday: Durable Goods Orders, New Home Sales
Thursday: US GDP, Services PMI, Michigan Consumer Sentiment
Friday: US Personal Spending and Pending Home Sales
Good luck this week folks!
Check out 2015 Track Record
Go to the bottom of this page in order to see the Legal Stuff
"The Fed didn't move interest rates and I won't talk about the implications of that as it is a useless exercise."
ReplyDeleteThat is the best statement I've read this morning and was definitely good for a chuckle.
As short term traders, the only thing worth knowing about fundamental information is when it will be released. What happens is up to the market and there's no way to use that information predictively.
The amount of energy spent this week on financial media sites, and social media guessing whether an interest rate was coming or not was unbelievable. With that amount of energy we could have solved crucial problems like Climate Change, Famine in Africa or AIDS. Instead it seems as if most traders and "specialists" prefer to focus on something that is void without bringing actionable, useful trading ideas to the table.
DeleteMost people thought that a rate hike would cause for the markets to fall. Well, they didn't raise rates and the market felt. How does you eye look after those comments? It's a useless waste of time. Twitter is pretty bad on Fed days, but this time it was remarkably useless. Zero value added.
Thanks for your comments Dan.
LT
"Had I not made adjustments to my trades I would have ended up making a lot of money in the September cycle"
ReplyDeleteI echo your statement above. None of my spreads got breached even when we closed down to 1867. But my rules tell me to close early when my short strike have reached a delta of 25 to 30. I don't regret closing as I would do it again if it happens in the future.
"You will enjoy 60% annual returns, until, one day, you inevitably end up with an 80% draw-down, and all is gone, forever."
We both know that there are risky newsletters out there that will push their luck too far until one day they blow up. I witnessed one yesterday that had a SPX September 2050/2040 credit put spread lose 100%. He originally had SPX August 30th 1950/1940 cps but was forced to do this risky adjustment at the end of August because he refused to close early. Instead of adjusting down, he adjusted up. Now his subscribers have a total loss.
Last week:
I did not make any trades last week. I almost got filled on SPX Dec 31st 2190/2215 ccs when SPX became overbought when it traded above 2017 on Thursday. But the market moved down so fast that I was not able to get filled.
Plan for next week:
I want to sell long-term RUT and SPX iron condor. If we become oversold, I will sell some individual credit put spread positions too. I am sitting on a lot of cash and will be putting it to use starting next week.
Current Positions:
3 contracts of SPX October 30th 1650/1640 cps - currently profitable
1 contract of SPX November 30th 1550/1525 cps - currently profitable
1 contract of SPX December 31st 1600/1575 cps - currently showing a small loss
1 contract of SPX December 31st 1500/1475 cps - currently profitable
1 contract of RUT September 30th 1070/1060 debit put spread
1 contract of SPX September 30th 1850/1840 debit put spread
It's the same story over and over again. Options selling newsletters boasting a 98% win rate, making money off monthly subscription fees, blowing up one day, then reinventing themselves under a new name, new website, a little marketing and starting the cycle all over again. Putting a bad name and reputation to option selling strategies and scamming poor souls out there. Thanks for sharing your positions. They all look good.
DeleteLT
Henrik,
ReplyDeleteThanks for your blog posts. I just recently happened onto your website and I'm interested in possibly getting your LT Options book. Do you think the principles, and in particular the adjustment and hedging techniques, if any, in your book would work equally well with short OTM strangles in SPX, SPY and /ES?
All the best,
Jim
Hi Jim,
DeleteThe principles are mostly fine tuned for defined risk trades (credit spreads and Iron Condors). Things are different with undefined risk trades as you can not accurately predict in advance what your loss will be when the adjustment point is hit. Also, with undefined risk trades you may get totally different credits while selling a specific probability option. That is, on a given month, the 10% probability of expiring in the money can give you twice as much credit as what the same probability option gave you two months ago. So, it is a different game. However, some principles of the system are applicable and more importantly can open your eyes for you to define your own strategies, fine tuned for dealing with naked options. As for instruments of choice, I barely use SPY if at all (reasons explained in the videos). I do not use /ES (much less liquid, yes good for buying/selling a single option and perhaps a strangle, but very hard for fills on Iron Condors, just look at open interest and volume at different strikes compared to SPX). But , yes, the principles for trading all three are the same.
The adjustment techniques and hedging techniques will definitely open your eyes, again the only difference is that with naked positions, the estimation of losses in advance will not be possible. With Iron Condors and Credit spreads I know in advance how much I will lose if I have to make an adjustment 2 or 3 weeks from now. I also know what are the credits I should obtain for opening my plays (hint, it's always the same), which is not possible with naked positions.
Thanks for your interest and your questions.
Cheers,
LT
LAST WEEK:
ReplyDeleteOn Thursday afternoon, during the FOMC meeting, I closed all six SPX Oct 1530/1550 cps. I bought them back for 0.15. Originally sold for 1.55. Profit +$840.
On Friday morning, when SPX opened down around -1% , I opened a new unbalanced iron condor spreads in SPX options with November expiration. I sold to open 7x SPX Nov 1680/1700 cps @1.30 and 5x SPX Nov 2120/2140 ccs @1.60. Total credit $1710 (with margin $12209).
OPEN POSITIONS:
9x SPX Oct 1580/1600 cps
7x SPX Nov 1680/1700 cps + 5x SPX Nov 2120/2140 ccs
9x RUT Oct 920/940 cps + 4x RUT Oct 1250/1270 ccs
7x RUT Oct 910/930 cps
NEXT WEEK:
I am currently bidding RUT Oct 910/930 credit put spreads at 0.10. If I can close them next week, I will open new credit spreads in RUT options with November expiration. Plus, I will watch open positions: I will adjust SPX credit spreads with SPX below 1900 and SPX above 2010. RUT credit put spreads will need some adjustment if RUT falls under 1020 and RUT above 1200.
Good trading,
Martin