The idea is to use calendars, trying to sell the high volatility in the front month and buy the lower volatility in the farther month for protection.
On December the 16th, OSX was ranging from 218 to 220 all day. The volatility of the 220 strike Dec PUT was higher than the Quarterly 220 Dec5 PUT. So I started a calendar there with the idea that once OSX moved away from that price later in the week another calendar would be opened, resulting in a Double calendar position.
November 16
SELL 1 OSX DEC 220 PUT @10.00 (+$1000)
BUY 1 OSX DEC5(Qtr) 220 PUT @11.60 (-$1160)
Two days later OSX moved to the upside and at that point I opened the second calendar, in the upside, so that now the price of OSX is in the middle of my Double Calendar. I played 2 contracts this time, giving more importance to this last movement:
November 18
SELL 2 OSX DEC 230 PUT @9.20 (+$920 X 2 = +$1840)
BUY 2 OSX DEC5(Qtr) 230 PUT @10.80 (-$1160 X 2 = -$2320)
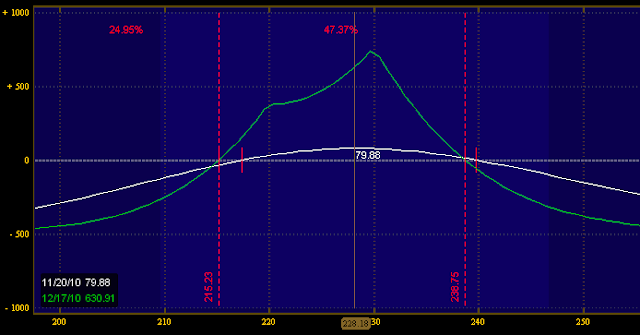
In both trades, a higher volatility was sold than what was bought, which results in a better risk/reward ratio in the trade. As a result we have the following position:
Notice how I am in the middle of the profit range, and that there is already a small profit of $79.88. The maximum risk is $480 and the maximum reward is over $700 although the profit curve varies, the position is profitable with OSX between 215.23 and 238.75 by expiration in December (Dec, 17th). This position benefits from time decay, so as time goes by I can start making profit if OSX stays within my range.
See how this trade played out
Go to the bottom of this page in order to see the Legal Stuff


No comments:
Post a Comment